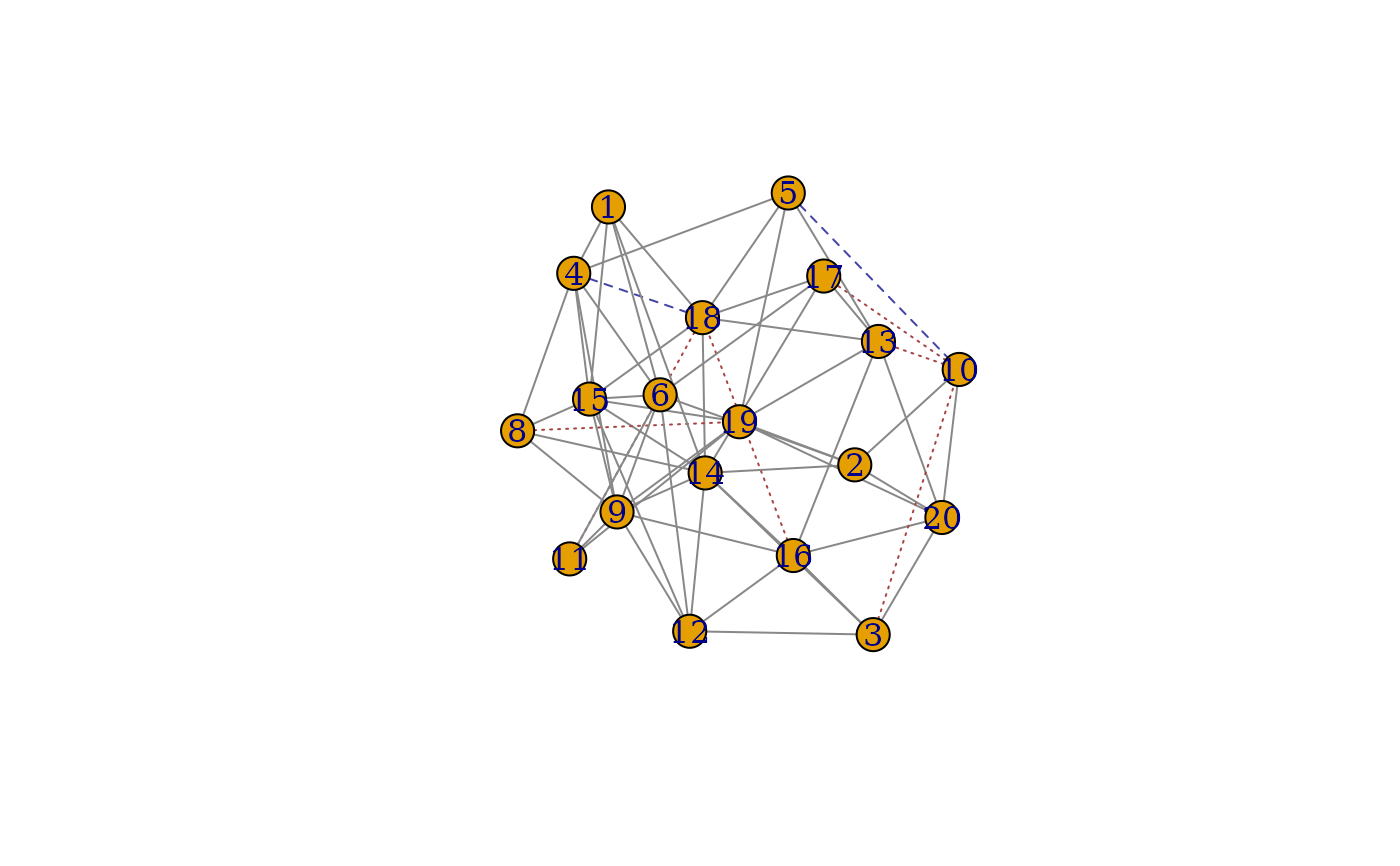
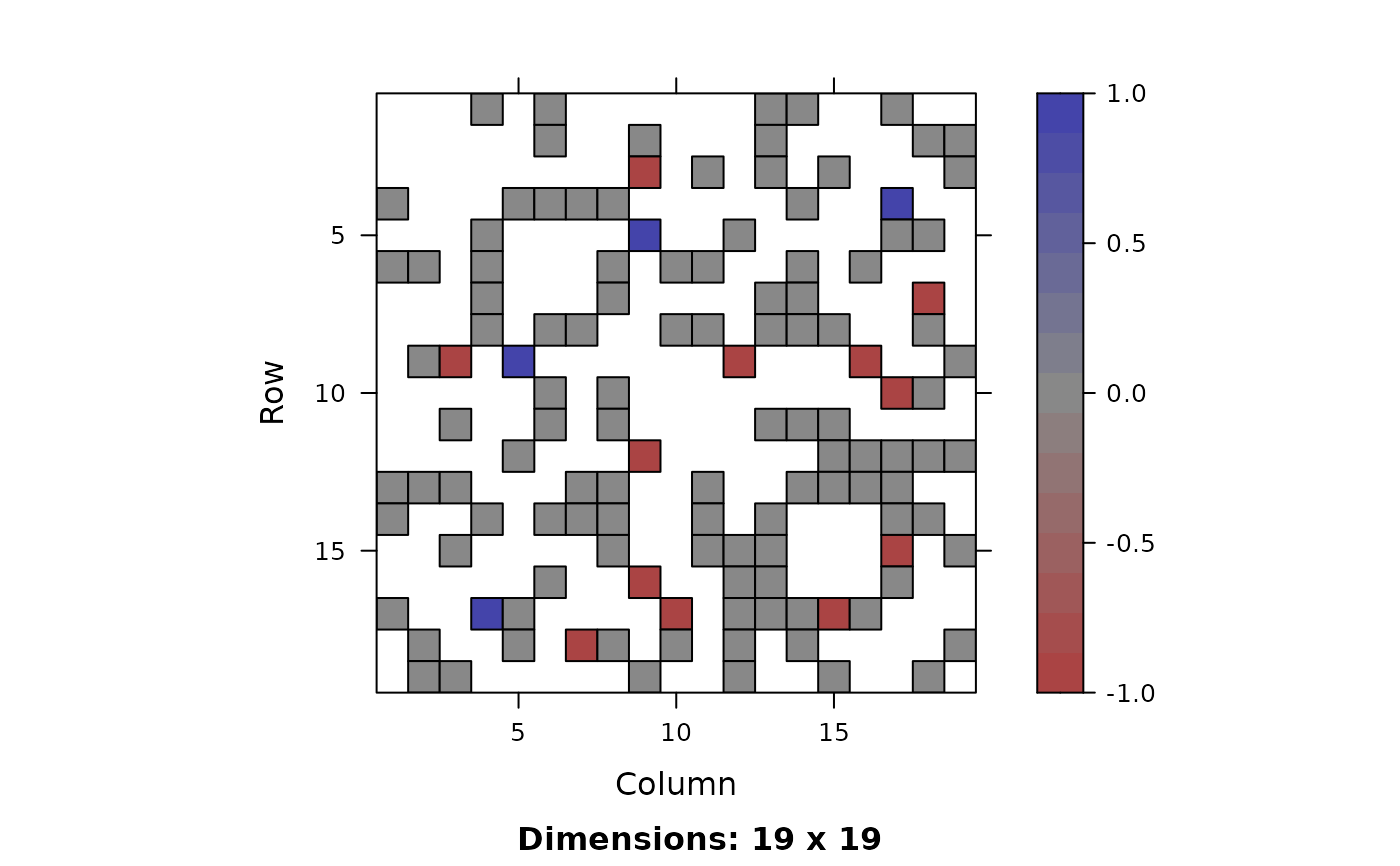
Two functions are provided, match_plot_igraph
which makes a ball and stick plot from igraph objects
and match_plot_matrix which shows an adjacency
matrix plot.
Arguments
- x
First graph, either an igraph object or a Matrix
- y
second graph, either an igraph object or a Matrix
- match
result from a match call. Requires element
corras a data.frame with names corr_A, corr_B.- color
Whether to color edges according to which graph(s) they are in.
- linetype
Whether to set edge line types according to which graph(s) they are in.
- ...
additional parameters passed to either the igraph plot function or the Matrix image function.
- col.regions
NULL for default colors, otherwise see image-methods
- at
NULL for default at values for at (ensures zero is grey), otherwise see image-methods
- colorkey
NULL for default colorkey, otherwise see image-methods
Value
Both functions return values invisibly.
match_plot_igraph returns the union of the
matched graphs as an igraph object with additional
edge attributes edge_match, color, lty.
match_plot_matrix returns the difference between
the matched graphs.
Details
Grey edges/pixels indicate common edges, blue indicates edges only in graph A and red represents edges only graph B. The corresponding linetypes are solid, long dash, and short dash.
The plots can be recreated from the output with the code plot(g)
for g <- match_plot_igraph(...) and col <- colorRampPalette(c("#AA4444", "#888888", "#44AA44")) image(m, col.regions = col(256))
for m <- match_plot_match(...).
This only plots and returns the matched vertices.
Examples
set.seed(123)
graphs <- sample_correlated_gnp_pair(20, .9, .3)
A <- graphs$graph1
B <- graphs$graph2
res <- gm(A, B, 1:4, method = "percolation")

plot(A, B, res)

plot(A[], B[], res)
